Abstract
Background: Hematopoietic neoplasms is diagnosed using a combination of several methods. They require complex equipment and highly skilled clinical laboratory scientists and technicians - scarce resources - which increase turnaround times as well as costs.
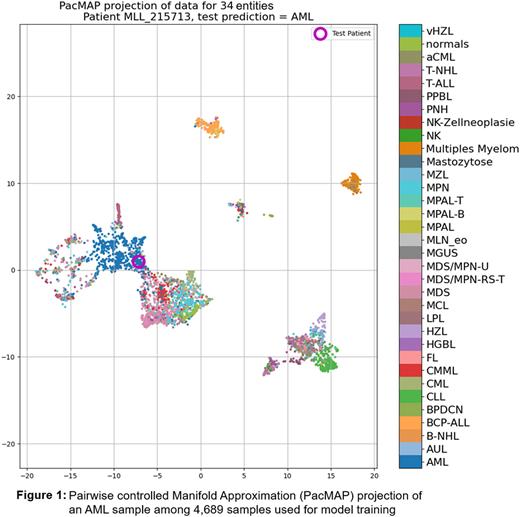
We previously reported (doi.org/10.1182/blood-2021-152970) on the creation of a web based multi-class classifier using Amazon Sagemaker and LightGBM to interpret WGS and WTS data to tackle the extremely challenging task of interpreting high dimensional data typically provided by these methods. Here we report on the validation of that algorithm with a prospective cohort. The multi-class classifier can detect 33 different hematopoietic neoplasms and normal peripheral blood/bone marrow (figure 1) and was trained on 4689 samples. With an across entities severely imbalanced (n: 20 - 773) training cohort, the model accuracy reached 85%.
Aim: Validate an AI algorithm predicting the disease entity based on WGS and WTS data only, while depicting relevant features for a decision and thus making its results transparent and verifiable by humans.
Methods: To evaluate the performance of the model we prospectively sequenced 325 samples sent to our lab between 06/2021 and 07/2022 for routine diagnostics with both WGS (100x coverage, 2x151bp) and WTS (50 mil reads/sample, 2x101bp) on NovaSeq instruments. Single nucleotide variants (SNV), structural variants (SV) and copy number alterations (CNA) from WGS data using a tumor w/o normal pipeline and gene fusions (GF) and gene expression (GE) from WTS were extracted. SNVs were filtered using common databases (gnomAD, HePPy, GiaB high conf). In parallel, independent final routine diagnosis based on gold standard techniques (GST) was established following WHO guidelines.
Raw data from each of the data modes from the sequencing experiment was uploaded to a cloud-based web application to start the analysis. Compute time per sample was approx. 1 min. Results were a list of prediction probabilities for each of the 34 entities per sample.
Results: Our primary focus for the head-to-head comparison in this prospective study were AML and ALL cases. 171 samples diagnosed with AML (n=102), BCP-ALL (n=55) and T-ALL (n=14). AML was correctly classified at the highest ranking probability in 90% of cases (n=92, median probability (mp) 77%). 6/10 incorrectly classified AMLs were classified as MDS (mp=36%). In these cases the second most likely predicted disease was AML in 3/6 cases. Only one BCP-ALL was misclassified, predicting 98% of the samples correctly with a mp of 94%. 11/14 (79%) T-ALLs were predicted correctly, also with a mp of 94%. In the 3/14 incorrect instances, the mp was 39%, with a second highest prediction in a similar probability range (38% vs. 31%, 39% vs. 34% and 61% vs. 24%).
Further our cohort comprised of 26 multiple myeloma (MM) cases, 24 were predicted correctly and 2 misclassified as MGUS, but with an almost equal probability for MM. The model is also capable of distinguishing normal samples, which do not belong to any of the 33 hematopoietic neoplasms. 6/6 samples were classified correctly as normal. Overall 236 / 325 (81%) were identified correctly. Our cohort included several intermediate/overlapping disease classes. In 46/89 of these cases, the second highest prediction was the correct diagnosis.
The focus of this AI approach was the identification of relevant genomic features (SNV, SV, CNV, GE and GF) for classification. Thus the emphasis on the transparency aspect of the AI model. We used a library called SHAP to extract the relevant features for each classification. In addition to the probability scores we extract all relevant features from each single data mode which contributed the most to the final predicted diagnosis and all data accessible through a simple cloud based web application. As this could be quite a few features per sample we try to map all features onto a dimensionality reduced similarity 2D plot called PacMAP (Figure 1). Among several other visual cues reported previously, this plot provides a quick sanity check for the AI model's output.
Conclusion: We tested an AI classifier in a real world environment, head-to-head to standard diagnostics method. Concordance was very high, in some instances of overlapping disease entities continued calibration is needed for higher accuracy. Previously hard to assess data becomes amenable through dimensionality reduction and visualization.
Disclosures
Nadarajah:MLL Munich Leukemia Laboratory: Current Employment. Maschek:MLL Munich Leukemia Laboratory: Current Employment. Hutter:MLL Munich Leukemia Laboratory: Current Employment. Meggendorfer:MLL Munich Leukemia Laboratory: Current Employment. Kern:MLL Munich Leukemia Laboratory: Current Employment, Other: Ownership. Haferlach:MLL Munich Leukemia Laboratory: Current Employment, Other: Ownership. Haferlach:Munich Leukemia Laboratory: Current Employment, Other: Part ownership.
Author notes
Asterisk with author names denotes non-ASH members.


This feature is available to Subscribers Only
Sign In or Create an Account Close Modal